
The final evaluation of the Comprehensive Primary Care initiative (CPC) published in Health Affairs in June described the project and concluded that it “did not reduce Medicare (emphasis added) spending enough to cover care management fees or appreciably improve physician experience.”
Because the Peikes, et. al. evaluation did not include the costs of any of the non-Medicare payers partnering in CPC, we wondered about the results the other payers were seeing.
Given that the private health plans were willing to continue and expand their foot print in the Comprehensive Primary Care Plus program (CPC+, the successor to CPC) were their results more positive? Additionally, if the physicians saw no improvement in their experience why did all 75 CPC practices in that region reapply for five more years in CPC+?
The Health Collaborative (THC) was the aggregator of multi-payer claims data for the OH/KY region in CPC, as such they collected and analyzed the multi-payer claims data from all 9 participating payers. Though our findings confirmed the findings of Peikes et al in the Medicare fee-for-service population, the multi-payer claims data provides evidence of considerable savings and utilization reductions in the Medicare Advantage population in OH/KY. The commercial population also showed considerable reductions in utilization. Examination of multi-payer data and informal surveys of participating physicians and health plans provide insights for the strong support of this model.
OH/KY (The Greater Cincinnati/Dayton Metropolitan Statistical Area) had one of the highest health plan participation rates among the seven CPC regions with 9 payers, including 5 commercial plans. Additionally, 75 primary care practices were accepted into CPC out of approximately 250 that applied, and all 75 participated for the full four years of the project. All of the OH/KY payers, including Medicare FFS and Ohio Medicaid, submitted claims data to THC for patients attributed to the 75 CPC practices. The data was collected from 2013 to 2016, encompassing 213,000 attributed lives from all payers out of the approximately 450,000 total lives in the combined 75 active practice populations.
All Payer Aggregate Results
The trends in the all payer claims data from the start to the end of CPC are impressive. Overall, total cost of care declined by 9%. Total admissions, ambulatory care sensitive condition (ACSC) admissions, emergency department (ED) visits, and specialist visits declined 33%, 45%, 17%, and 24%, respectively (Chart 1). The high levels of post discharge follow up, post ED calls, and individual care management by the practices might be key drivers for these reductions in utilization and subsequent cost. The greater reduction in the ACSC admissions is consistent with a primary care-focused intervention. This effect was wide spread among the practices with more than 90% of them demonstrating substantial improvement.
THC further analyzed some of these outcome trends by dividing the payers into three different payer types: Government (Medicare FFS and Medicaid), commercial, and Medicare Advantage (Table 1). The Medicare Advantage population demonstrated the greatest improvement, including an eye-popping 37.2% decrease in overall costs and large reductions in all utilization metrics. The Commercial population had positive trends in ACSC and total admissions but ED visits and costs remained flat over the four years.
Chart 1: Results for all-payer claims data for OH/KY CPC practices from 2013-2016.
It should be noted, the annual price as reported by commercial carriers in this market increased over the four years, averaging approximately 5% annually. This partially offset any reduction in cost from utilization reductions. Consistent with findings of Peikes et al, the Government payer population in OH/KY had no statistically significant impact on total cost. These calculations did not include care management fees and would support their conclusion that the project did not recoup any significant portion of that additional expense.
Table 1:
Analysis by payer type of all-payer claims data for OH/KY CPC practices from 2013-2016.
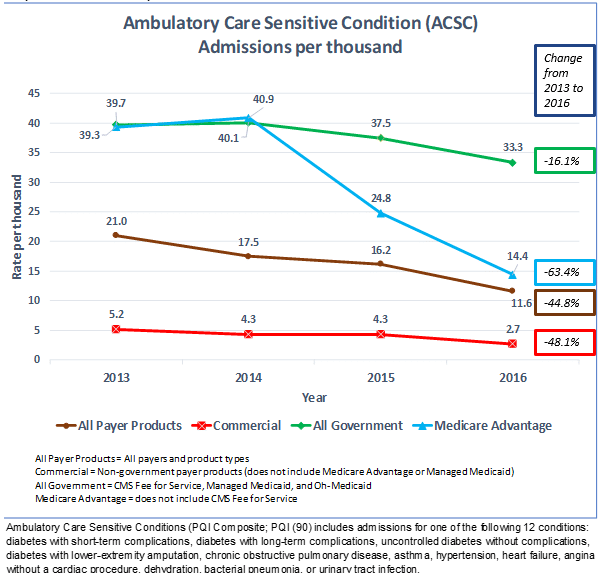
Across all payers, ACSC admissions declined by 45%; the largest decrease in utilization observed. ACSC admissions declines differed considerably among the different payer types, with reductions of 63% (Medicare Advantage), 48% (commercial payers) and 16% [n.s.] (Government payers), respectively. These reductions occurred predominately in the final two years of the project (Graph 1) when care management interventions within the practices were mature, further supporting a relationship with the primary care intervention.
Graph 1: ACSC Admissions per Thousand
Why the Differences in Outcomes Between Payers?
In the Government population the only statistically significant change seen was as an increase in ED visits. Despite the 16% decrease in ACSC admissions it did not achieve statistical significance and costs were also unchanged. This is in contrast to the dramatic reductions seen in the MA and commercial populations. These populations come with greater financial resources, are, on average, healthier and frequently have greater interpersonal support with their health care. Thus, these populations may derive more benefit (or benefit more quickly) from the improvements in primary care delivery inherent in this model. When one considers what is involved with changing these utilization metrics, considerable resources need to be invested to move the needle, especially for the poor, elderly and disadvantaged beneficiaries in the Government group. Significant gaps in social determinants of health in this population – such as the lack of transportation or stable housing – can more negatively impact treatment adherence.
The relative difference in reduction in utilization observed in the Medicare Advantage versus the commercial populations is most consistent with better clinical control of chronic disease. With higher disease prevalence in the MA population there is more opportunity for impact. Another possible explanation is the introduction of high deductible plans during the 4 years of CPC as it might have contributed to the reduction in hospital and ED utilization. Yet this would not explain the greater reductions seen in the MA population where high deductible plans were not as characteristic. Nor does it account for the greater reduction in ACSC admissions compared to total admissions in the commercial population.
Why are Private Health Plans Proceeding with the Model?
In conversation with three of the private health plans that participated in CPC several reasons for continued participation emerged. Consistent with the all-payer data trends for MA and commercial populations, the private plans saw significant decreases in cost when comparing CPC practices to non-CPC internal cohorts. Two saw reductions sufficient to cover the cost of care management fees paid to the CPC practices. One realized significant savings net of care management fees and shared a proportion of those savings with the practices. In addition all three included other in-kind support provided to the practices in their calculations of total cost.
Other reasons were cited as important:
- Generally, they saw significant quality of care improvement. Bonus or shared savings payments were contingent on meeting quality targets.
- They were committed to value based payment models with most of their physician networks and the CPC program fit nicely into that business strategy.
- The multi-payer approach of CPC meant practices could reach the critical mass of necessary funding to support overall practice change.
- Some observed that funds previously spent on care management internally were more effective when diverted to the practice, as patient engagement was better.
- One was able to demonstrate to their large self-funded employers that the investment was financially better than break-even, while also delivering better quality.
In short, private health plans confirmed that they were seeing better results in many different areas and that their investment in CPC practices was financially viable. They also noted the added bonus that their physician networks were requesting these arrangements.
The CMS Evaluation of CPC versus data payers use to make business decisions
As required by its authorizing statute, CMS rigorously evaluates each of its Innovation Center models. In CPC, this evaluation tested the effects of the intervention on CPC practices and their attributed Medicare FFS patients compared to propensity-matched practices and their patients using a difference-in-difference analysis. Such an evaluation is resource intensive and results can take a year or longer to produce. Yet the evaluation is critical in determining how a model affects the quality and cost of care, and thereby whether it meets criteria for model expansion.
The cost and time to do such a rigorous evaluation as required by the government is not practical in the private setting. By necessity, business decisions are often made based on the data that are available, despite apparent imperfections. The all payer data presented here is compelling, though it does have limitations. The data are not compared to a matched control group and, as a result, the data do not account for secular trends that might have affected outcomes and causation cannot be established. Yet these changes are what the payers are seeing and why they have continued in the program. Indeed, they have done some of their own internal comparisons to non-CPC practice cohorts and have seen enough evidence to proceed and expand on this VBP model.
The all payer data presented here is not risk adjusted. Risk adjustment is important for comparison of performance across different populations or across different providers but is less important when looking at the same population (or same population mix) over time. Employers and commercial health plans have relatively stable, low risk, healthier populations. So, the actual (unadjusted) trends may be adequate for making business decisions. Such a comparison does require a few assumptions: That the level of disease within the population is relatively stable from year to year, and that no significant external events occurred (such as other programs or changes in pricing) that might confound the results. The health plans would be in the best position to know if anything significant had changed in their populations or their programs.
What about Physician Acceptance?
In addition to aggregating the claims data in OH/KY, THC also convened primary care practices in the region to learn and share with each other transformation barriers and successes. To understand the impact of CPC on physicians, THC selected approximately 25 physicians (approximately 10% of the total) from various practice settings – including hospital/system owned, large independent group, and small independent practices – for an informal in-person survey just after the program ended. In addition to multiple suggestions for improving the program, four general themes emerged:
- No one wanted to return to straight FFS payment and all were applying to participate in CPC+.
- Many reported increased professional satisfaction from providing comprehensive care management to their patients.
- Many agreed that it did not reduce their work time (a few stated it actually increased it) but the time they spent felt more productive.
- There was a general acknowledgement that there was a 2-3 year learning curve before practices could meaningfully implement the changes in the CPC model.
Interestingly, financial considerations were not top of mind for the physicians surveyed. While acknowledging that the care management fees were necessary to allow the changes within their practices, those and other financial incentives were not the prime reason for their involvement. Rather the sense was that if the non-financial advantages had not been realized, pay alone would have been insufficient.
Based on the survey results above and that 100% of practices remained in CPC and applied to CPC+, the physicians in OH/KY evidently see substantial benefit in the model. Given the significant physician dissatisfaction in primary care today, that is a very positive outcome.
Conclusion:
The trends in the all payer claims data show the CPC investment in comprehensive primary care appears to have great promise for reducing cost and utilization in the Medicare Advantage and Commercial populations, with less of an impact on utilization and cost in the Government population. The commercial results should be of particular interest to self-insured employers who have often been reluctant to engage in primary care transformation models that require additional investment. For the government programs to see similar outcomes, a longer period of investment in care delivery and skill building within the practice may be required, given their vulnerable populations. It stands to reason that practices’ expertise in care management and other necessary primary care functions may have to evolve to a higher art form to impact a population with more challenging needs. With these very different results observed in other populations, the government programs might be encouraged to stay the course in these models as the improvements in value for their beneficiaries may take longer. The recent attention to social determinants of health may accelerate the improvement in these outcomes. It remains a working theory that the better control of chronic disease may translate to fewer hospitalizations, lower ER utilization, fewer specialist visits and lower cost. These relationships will be important to explore in CPC+ as it continues over the next 4 years.